| Percentage of Women in Mathematics in Europe | ||||
|---|---|---|---|---|
| Country | Students | Ph.D.'s | Mathematicians | Full Prof. |
| Austria '89 | 39% | 3/21=14% | 54/762=7% | 0/73=0% |
| Belgium | 54% | 12/32=38% | 30/219=14% | 8/134=6% |
| Bulgaria | 40% | 4/23=17% | 254/855=30% | 1/42=2% |
| C.S.F.R | 42% | 1/10=10% | 60/500=12% | 2/65=3% |
| Denmark | 30% | 1/5=20% | 4/121=3% | 1/19=5% |
| Denmark '95 | 30% | 0.75/41)=19% | 3/121=2% | 1/21=5% |
| Estonia | 60% | 0/4=0% | 32/109=29% | 0/8=0% |
| Finland | 41% | 8% | 3/127=2% | 1/34=3% |
| Finland '95 | 37% | 1/6=17% | 9/146=6% | 1/34=3% |
| France | 30% | 20% | 20-25% | 8% |
| France '95 | 10% | |||
| W. Germany '87 | 33% | 19/208=9% | 40/1500=3% | 4/490=1% |
| Greece | 67/283=24% | 3/56=5% | ||
| Georgia | 70% | 1/28=4% | 486/1217=40% | 7/72=10% |
| Hungary | 15% | 5/38=13% | 32/281=11% | 4/103=4% |
| Ireland | 30% | 2/3=67% | 7/135=5% | 0/9=0% |
| Israel '95 | 45% | 10/37=27% | 15/295=5% | 5/165=3% |
| Italy | 70% | 609/1727=35% | 84/646=13% | |
| Iceland | 33% | 0/0 | 0/10=0% | 0/4=0% |
| Luxemburg | 24% | 1/7=14% | 1/5=20% | |
| Macedonia '95 | 73% | 7/11=64% | 25/56=45% | 1/12=8% |
| Netherlands | 22% | 2/41=5% | 19/437=4% | 1/88% |
| Norway | 20% | 0/5=0% | 9/103=9% | 3/45=7% |
| Norway '95 | 29% | 3.25/14.751)=22% | 8/117=7% | 3/67=4% |
| Poland (5 univ.) | 60% | 3/16=19% | 107/359=30% | 7/44=16% |
| Portugal | 50-60% | 40-50% | 5% | |
| Slovakia '95 | 29% | 4/11=36% | 149/482=31% | 1/27=4% |
| Slovenia '95 | 52% | 0/2=0% | 4/51=8% | 0/14=0% |
| Spain | 168/1075=16% | 12/279=4% | ||
| Sweden | 30% | 1/10=10% | 7/150=5% | 0/21=0% |
| Sweden '952) | 1/141) | 22/310=7% | 0/41=0% | |
| Switzerland | 25% | 4/42=10% | 3/141=2% | 0/91=0% |
| Switzerland '95 | 20-30% | 10/50=20% | 4/150=3% | 2/90=2% |
| U. Kingdom | 31% | 46/266=17% | 97/1397=7% | 3/267=1% |
| U. Kingdom '953) | 37% | 36/198=18% | 250/2143=12% | 10/325=3% |
| Ukraine | 50% | 1/3=33% | 31/145=21% | 1/33=3% |
| Yugoslavia | 60% | 4/24=17% | 91/530=17% | 12/132=9% |
1) Average figures.
2) Broader definition of mathematicians.
3) Polytechnics are now universities; the number of universities has increased from 50 to 150.
| Lähde: | 2nd European Congress of Mathematics, |
| Budapest, Hungary, July 21-27, 1998. | |
| Round Table D: Women and Mathematics. |
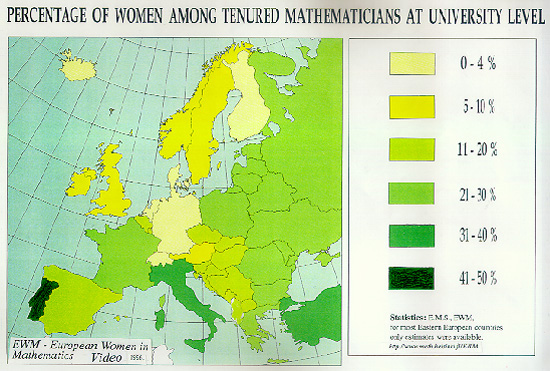
| Lähde: | Video: Women and Mathematics across Cultures, 1996 |
| European Women in Mathematics | |
| http://www.math.helsinki.fi/EWM/ |